Debugging Code with the Visual LISP IDE
Ever spent a few hours writing a fantastic program only to find that it crashes the first time it is run?
Now where could that error have come from...?
If you've ever delved into the world of AutoLISP, (or any programming language for that matter) I can almost guarantee that you will have, at some point, encountered an error when writing & running a program - it's almost inevitable:
As soon as we started programming, we found out to our surprise that it wasn't as easy to get programs right as we had thought. Debugging had to be discovered. I can remember the exact instant when I realized that a large part of my life from then on was going to be spent in finding mistakes in my own programs.
- Sir Maurice Wilkes
At this point most users will find themselves scouring the code for typos and other such mistakes - a process which could take just as long as writing the program itself.
This tutorial aims to teach you how to use the debugging facilities offered by the Visual LISP IDE (VLIDE) to immediately detect the point at which a program has crashed and furthermore show you the steps you can take to determine why the code has crashed at that particular point.
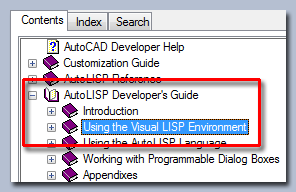
This tutorial assumes the user has a basic knowledge of how to use the Visual LISP IDE. If you are not one of these users, I would suggest that you give this a read: An Introduction to the Visual LISP IDE.
Contents
An Example Program
Throughout this tutorial I shall demonstrate various debugging methods using the following test code which simply prompts the user for a selection of line entities and proceeds to print the combined total length of the lines to the AutoCAD command-line.
(defun c:linelen ( / ent enx idx sel ssl tot )
    (if (setq sel (ssget '((0 . "LINE"))))
        (progn
            (setq ssl (sslength sel)
                  tot 0.0
                  idx 0
            )
            (while (<= idx ssl)
                (setq ent (ssname sel idx)
                      enx (entget ent)
                      tot (+ tot (distance (cdr (assoc 10 enx)) (cdr (assoc 11 enx))))
                      idx (1+ idx)
                )
            )
            (princ (strcat "\nTotal length of lines: " (rtos tot)))
        )
    )
    (princ)
)
(Can you spot the error in the code already?)
Begin by opening AutoCAD and typing VLIDE at the command-line to open the Visual LISP IDE. Open a New File (File » New File or Ctrl+N) and either type or copy the above code into the editor window.
Firstly, let's see what error message we are receiving.
Draw a few lines in AutoCAD with which to test the program. Now load the code in the editor window (Tools » Load Text in Editor or Ctrl+Alt+E), and run it in AutoCAD by typing the command syntax 'linelen' at the command-line.
After selecting a few lines, you will receive this error message at the command-line:
; error: bad argument type: lentityp nil
Where did the Code Fail?
If done manually, this is probably the most tedious and time consuming element of the debugging process: finding where exactly in the code the program has failed. Luckily, the VLIDE offers an easy way to immediately determine the point at which a program fails.
To answer this question, navigate back to the VLIDE and go to Debug » Break on Error. Ensure this option is ticked.
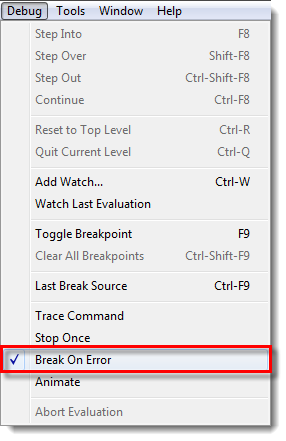
By setting this option, the VLIDE will set a break point at the AutoLISP expression at which the code fails. A break point is similar to a 'bookmark' in the code and will cause the program to pause evaluation at the expression marked by the break point. By instructing the VLIDE to automatically set a break point when the program encounters an error, we can later return to this break point and quickly identify the source of the error.
Be aware that assigning break points in the Visual LISP IDE does not modify the AutoLISP file in any way, and such break points are not stored after the AutoLISP file is closed.
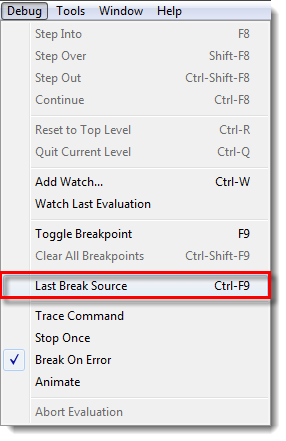
Now, in AutoCAD, run the program again. When the code errors, navigate back to the VLIDE window and go to Debug » Last Break Source (Ctrl+F9).
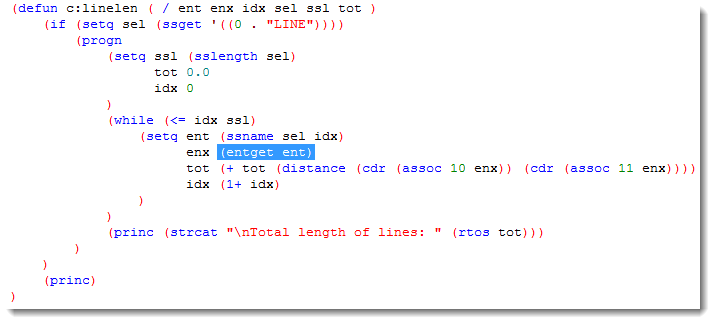
The expression at which the code has encountered an error should be highlighted in the VLIDE Editor window:
Finally, reset the break point by going to Debug » Reset to Top Level (Ctrl+R); this removes the break point and resets the paused interpreter (the object that evaluates the AutoLISP code) to the start of the program.
So, now we know where the code fails, but why does it fail at that point?
Why did the Code Fail?
To help answer this question the VLIDE has a few other tools we can utilise.
Since we know that the error occurs within the while loop, we shall focus our debugging efforts on that section of the code.
Adding Break Points
As noted earlier, break points pause evaluation of the AutoLISP code, this can be thought of as similar to pressing the pause button on a cassette player - the reader head is no longer 'evaluating' the magnetic tape in the cassette and converting it to electric pulses sent to the speakers.
By pausing the AutoLISP interpreter, we can take control of the flow of evaluation, starting & stopping the code when and where we like.
To do this, in the VLIDE Editor window, place your cursor in front of the opening bracket of the while expression, click, and go to Debug » Toggle Break Point (F9). The opening bracket of the while expression should be highlighted red.
Now place your cursor behind the closing bracket of the while expression and add another break point following the same method as above.
Watching Variables
The Visual LISP IDE also allows us to 'watch' variables used in the code, displaying their values as the code is evaluated. With this in mind, let's add a watch to the index variable idx and the variable holding each line entity: ent.
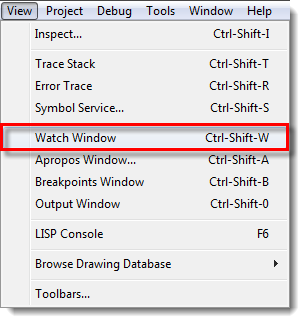
To do this, double-click on any instance of the idx variable to highlight it and open the Watch Window by going to View » Watch Window (Ctrl+Shift+W).
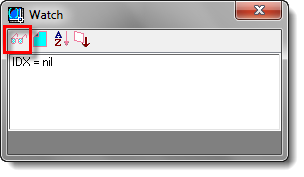
The variable idx should now appear in the Watch Window list, with a value of nil (since it is local to the program and does not hold a value until the relevant setq expression is evaluated in the code).
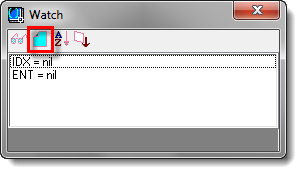
With the Watch Window still open, double-click on any instance on the ent variable and click on the Add Watch button in the Watch Window (the button with the glasses symbol):
This variable should also now appear in the list, also with a value of nil.
Animating the Code
With our break points set & variables watched, we are now set to animate the code evaluation.
Switch to the AutoCAD window, and run the program once more by again typing linelen at the command-line.
When the code evaluation reaches our first break point, code evaluation will be paused and the VLIDE Editor window will appear, highlighting the code between the two break points. From here, we have complete control over the code evaluation. We can step into and out of expressions and evaluate them as we please.
For now, go to Debug » Animate and ensure this option is ticked.
Now go to Debug » Continue (alternatively click on the green arrow on the Debug Toolbar, or press Ctrl+F8).
The code should now start to evalute, expression by expression from the break point set earlier:
Notice how the variables in the Watch Window will change their values as the various setq expressions within the while loop are evaluated.
The values shown in the Watch Window reveal the cause of our error: the value of the ent variable becomes nil when our integer selection set index variable idx reaches 2.
This indicates that no entity is found in the selection set sel at the index 2, meaning that the test condition for the while loop is allowing the counter to get too high before the test condition returns nil and hence ceases evaluation of the while loop.
Resetting the Environment
Now that we have identified the cause of our error, we can reset the VLIDE environment.
Reset the AutoLISP interpreter by going to Debug » Reset to Top Level (Ctrl+R) - this is analogous to pressing the 'Stop' button on our cassette player.
Clear all break points by going to Debug » Clear all Break Points (Ctrl+Shift+F9), accepting the prompt.
Clear the Watch Window by clicking on the Clear Window button in the Watch Window.
Finally, go to Debug » Animate and Debug » Break on Error and uncheck these options.
Fixing the Code
Now that we have identified where and why the code is failing, we can look to implement a change in the while test condition and hopefully fix the error.
In my demonstration I have selected 2 line objects, and, since the selection set index is zero-based (i.e. the first entity resides at index 0), the index variable idx should take integer values in the range 0 to 1.
With this knowledge, we can fix the code in the following way:
(defun c:linelen ( / ent enx idx sel ssl tot )
    (if (setq sel (ssget '((0 . "LINE"))))
        (progn
            (setq ssl (sslength sel)
                  tot 0.0
                  idx 0
            )
            (while (< idx ssl) ;; Changed <= to <
                (setq ent (ssname sel idx)
                      enx (entget ent)
                      tot (+ tot (distance (cdr (assoc 10 enx)) (cdr (assoc 11 enx))))
                      idx (1+ idx)
                )
            )
            (princ (strcat "\nTotal length of lines: " (rtos tot)))
        )
    )
    (princ)
)
Further Information
For more information about the debugging capabilities of the Visual LISP IDE (VLIDE), refer to the VLIDE Help Documentation: